Background

This bachelor project was carried out in collaboration with Testarena Innlandet, an innovation arena that connects businesses, academia, and the healthcare sector in the Innlandet region. The goal was to create a digital solution that made Testarena Innlandet more visible and approachable to small and medium-sized businesses, while also giving the organization a more efficient way of handling incoming requests.

About the project

My Role

I worked as a designer, responsible for user experience and visual design. My tasks included creating wireframes and prototypes, testing them with real users, and refining the design based on feedback. I was also involved in research and idea development, and I collaborated closely with the developers to make sure the final solution aligned with both user needs and technical requirements.

Team and Collaboration

This was a cross disciplinary project, where I had the opportunity to work together with one other designer and two developers. The collaboration was key to the success of the project we combined user-centered design with strong technical implementation, which allowed us to deliver a solution that was both functional and intuitive.

Tools and Methods

We followed the Triple Diamond methodology, moving from research and insights, to concept development and testing, and finally to implementation. We used Figma for design and prototyping, and worked with workshops, affinity mapping, user journeys, and iterative testing to develop and validate our ideas.

The Problem

Potential users often struggled to understand what Testarena Innlandet offered, who it was for, and how to get in touch. At the same time, administrators managed all inquiries manually via email, which was inefficient and created confusion.

The Solution

Our final result was a digital platform with two parts: a user-friendly website that communicated clearly with small and medium-sized businesses, and an administration dashboard that gave Testarena’s staff better structure and efficiency in their daily work. The design emphasized clear communication, intuitive navigation, and a structured flow of information.

Key Learnings

This project showed me how important it is to involve users at every stage of the process. Iterative testing gave us valuable insights and helped us shape a solution that truly met user needs. It also reinforced how essential close collaboration across disciplines is when building digital solutions that are not only functional, but also user-friendly and visually consistent.

Triple Diamond Design Methodology

We adopted the Triple Diamond model based on DOGA's framework, extending beyond the traditional Double Diamond to include an implementation phase. This approach was essential for our interdisciplinary team of interaction designers and web developers, allowing us to take concepts through to full technical realization.

Research & workshop

We started the process with a workshop together with five representatives from key partners such as Gjøvikregionen, NTNU, Sykehuset Innlandet, and HelseInn. The goal was to clarify the problem space and identify potential target groups for Testarena Innlandet.

During the workshop, participants generated ideas for possible target users, which we structured and prioritized using dot voting. This gave us three main groups: businesses, researchers, and hospitals.

In the next step, we carried out a needs analysis using sticky notes to map motivations, challenges, and barriers for each group. The insights revealed shared needs such as access to expertise, clinical test environments, and collaboration opportunities. At the same time, lack of time and unclear communication from Testarena were highlighted as key obstacles.

Since Testarena was still in an early development phase, it was considered too broad to address all three groups simultaneously. Together with the participants, we decided to focus primarily on businesses as the main target group, as they had the clearest and most concrete needs for test facilities.

User Interviews & Insights

After narrowing the target audience to businesses, we conducted in-depth interviews with startups, incubators, and administrators. Incubators were included because they act as an important bridge between companies and test facilities.

The interviews revealed clear needs: Testarena had to communicate its offerings in a simple and transparent way, highlight the value of collaboration, and ensure access to competence and resources. Price and support were also critical for startups. This insight directly influenced how we structured the website and the inquiry form.

For the administration side, interviews uncovered issues with unclear responsibilities, fragmented information, and inefficient workflows. Requests were spread across Outlook, Teams, and Salesforce, which led to lost data and double work. We clustered these findings through affinity mapping, which guided design decisions for the admin dashboard.

Observations

In addition to interviews, we observed how users interacted with Testarena’s existing website and form. The findings were clear:

  • The website was hard to find and its purpose unclear.

  • The form was too long, inconsistent, and confusing.

  • Several fields were unclear, and no proper confirmation was given after submission.

  • In some cases, submitted forms were not received at all by the administrators.

These observations confirmed many of the pain points uncovered earlier: unclear communication, inefficient workflows, and lack of structure. They also emphasized the need for a more reliable, user-friendly, and structured digital platform.

Concept Development

In this phase we defined the problem through four How might we questions, focusing on communication, usability, and handling inquiries.

We used a Crazy 8’s exercise to generate quick ideas for both the website and the admin dashboard. Many sketches highlighted clear navigation, simpler inquiry flows, and step-by-step guidance.

The strongest elements from our sketches were combined into one concept, which became the base for our first prototypes.

Personas & User Journeys

To better understand user needs, we created two personas: Anders, representing businesses looking for test facilities, and Lise, representing administrators handling inquiries.

Through empathy maps and user journeys, we visualized their frustrations and goals. Anders struggled with unclear information, scattered websites, and lack of trust in the inquiry process. Lise faced inefficient workflows, unstructured data, and unclear responsibilities when managing requests.

These insights gave us a clear picture of user pain points and guided the structure of the website, the inquiry form, and the admin dashboard.

User Flows to Structure

We created user flows for both businesses and administrators. These visualized how users moved from landing on the homepage, searching for information, and submitting an inquiry, to how staff handled and followed up requests internally.

The flows helped us identify points of confusion and inefficiency, guided by principles like Hick’s Law (too many choices slow decisions) and Fitts’s Law (efficiency in navigation).

Based on these insights, we designed a clear information architecture and service maps. We simplified navigation, merged overlapping pages, and streamlined the inquiry form with a progress bar and confirmation message to improve trust and usability.

Design System

Before moving into prototypes, we worked on a small design system to make sure the website and dashboard felt consistent. We defined colors, typography, spacing, and reusable components like buttons, forms, and navigation elements.

The goal wasn’t to create a full-scale design system, but to set some ground rules so the solution looked coherent and was easier to develop later. This also saved us time when building prototypes, since we could reuse components instead of designing everything from scratch.

Prototyping & Testing

We built low- and high-fidelity prototypes in Figma for both the website and the admin dashboard. Testing with users and Testarena’s staff gave us clear feedback:

  1. The inquiry form needed a progress bar, the contact page was confusing and removed,

  2. Case studies had to be more visible.

  3. And the dashboard needed search and filters.

With each iteration, the prototypes became more refined and aligned with what users actually needed.


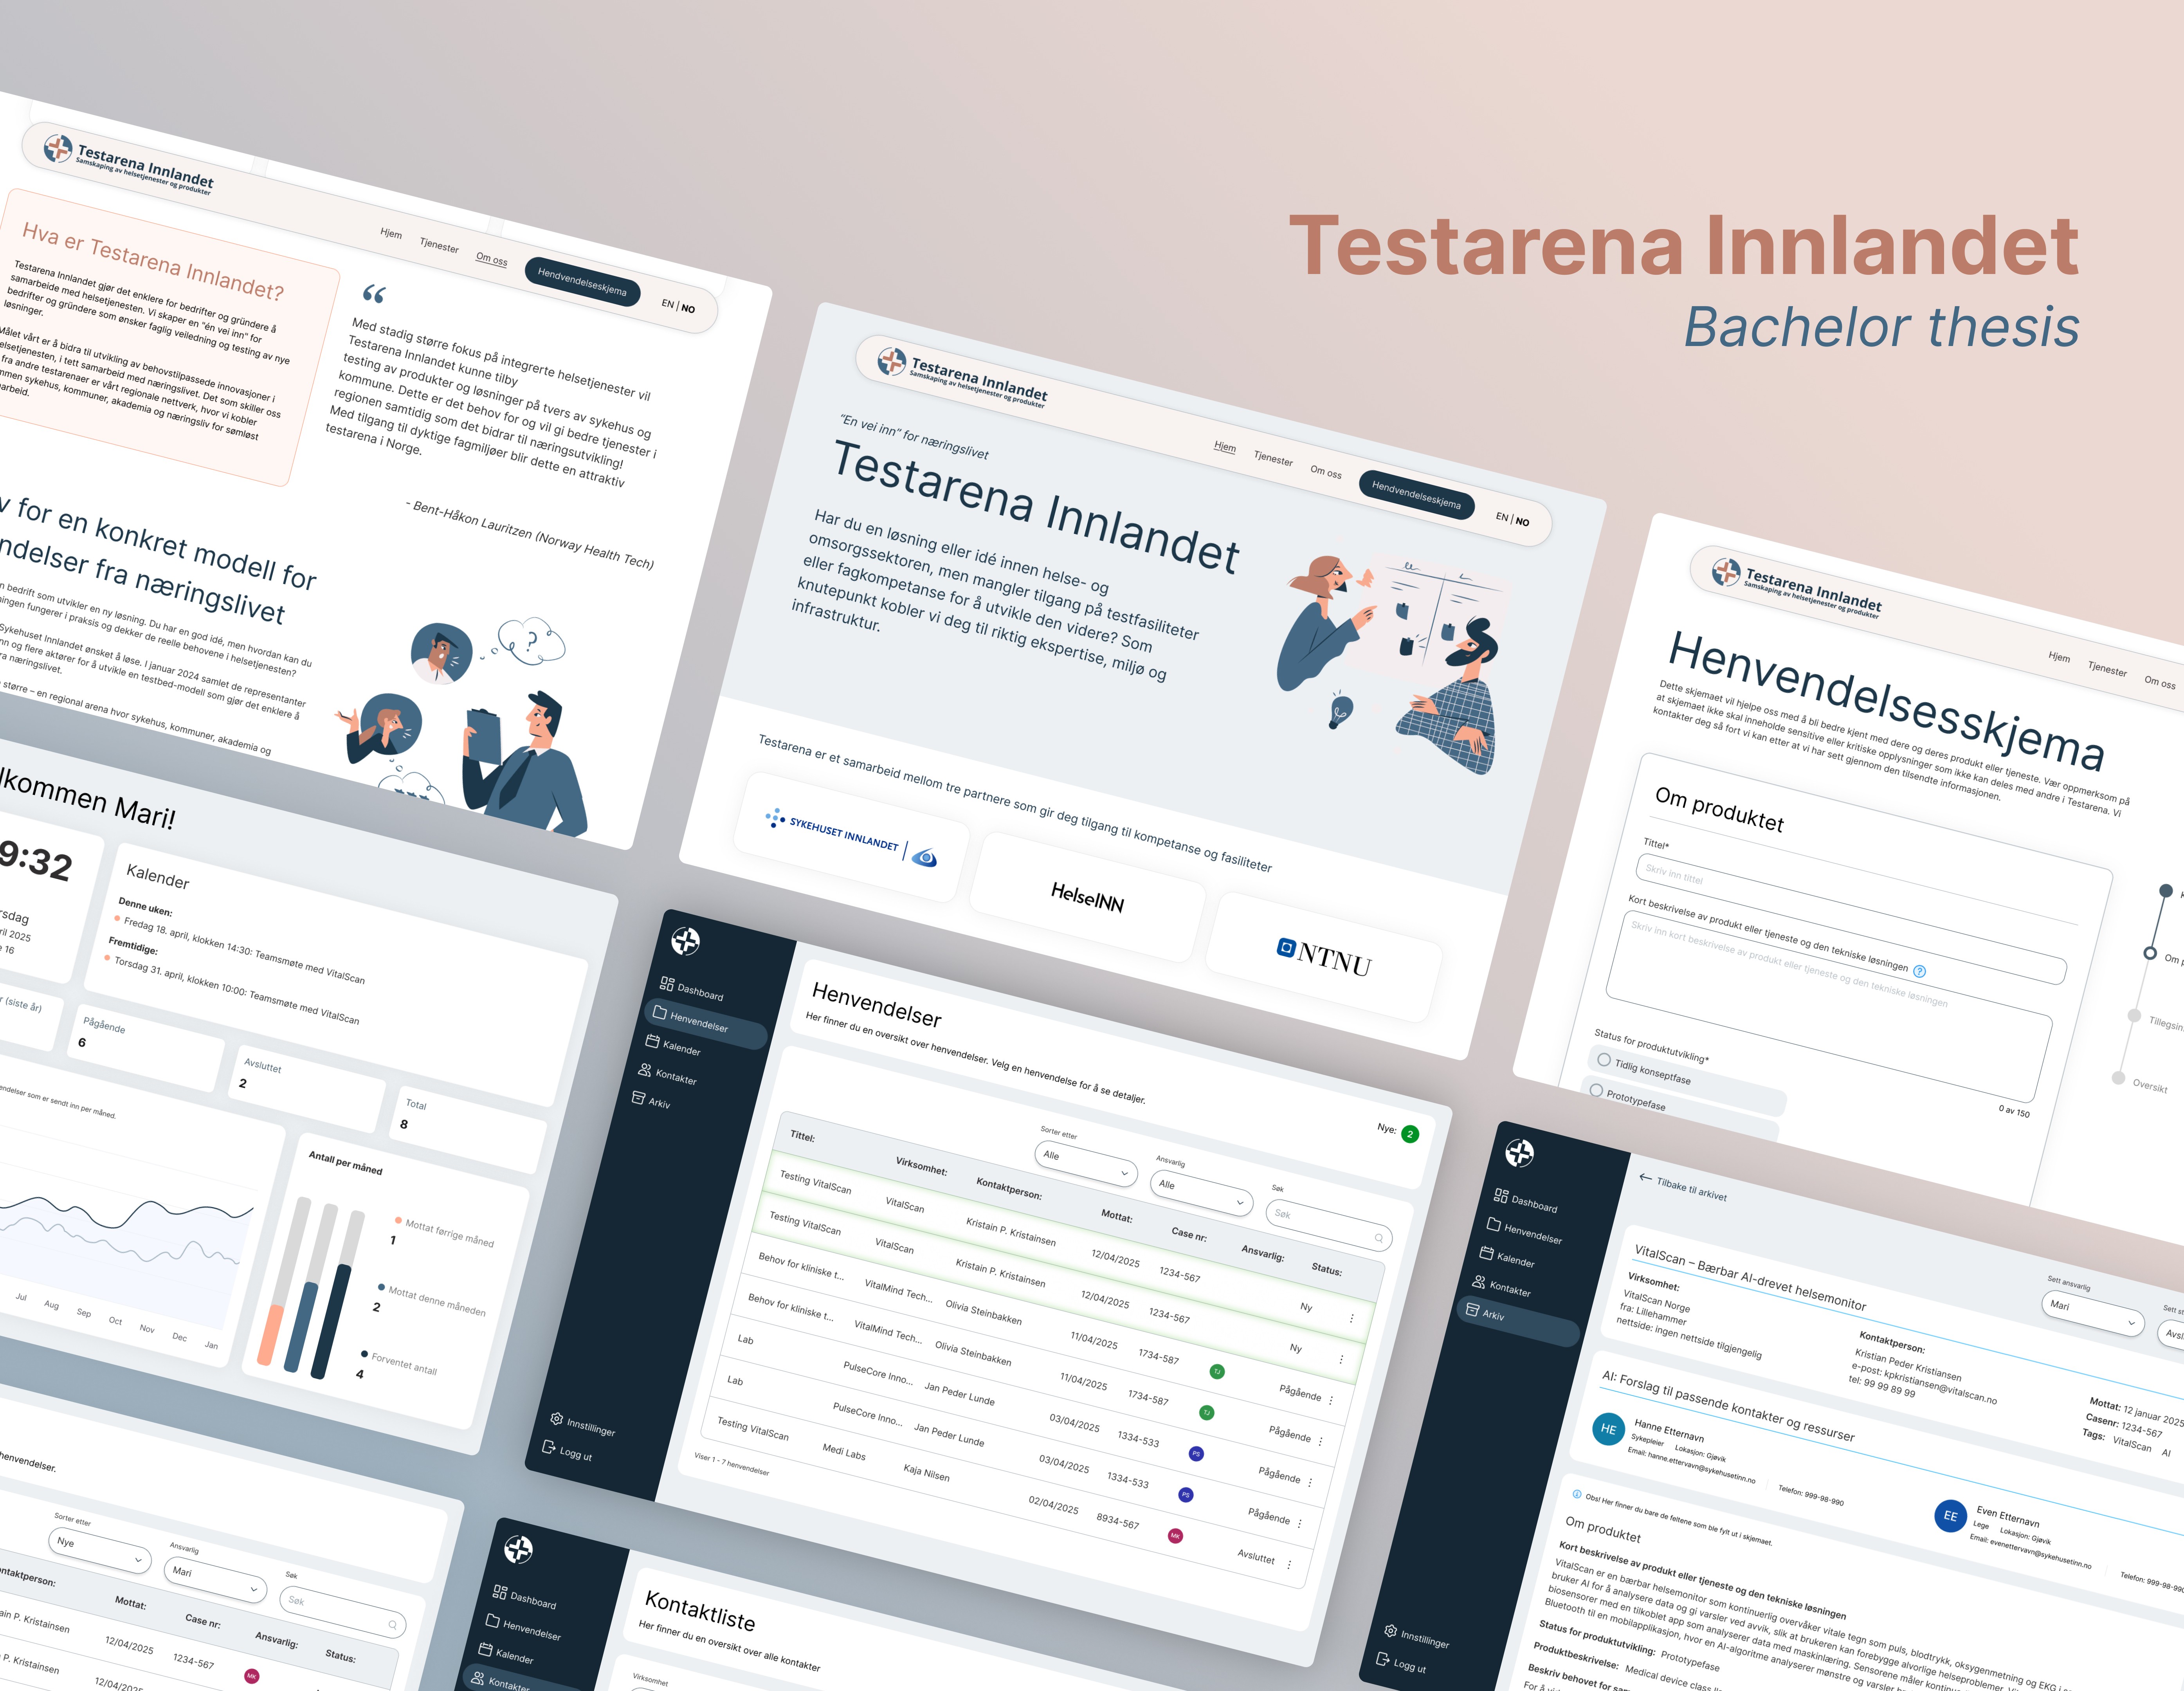
Final Solution & Reflections

The final outcome was a digital platform with two parts:

  • A website that communicates clearly with businesses and makes it easy to send inquiries.

  • An admin dashboard that helps staff handle requests in a structured and efficient way.

What I really take away from this project is how important it is to involve users at every stage. By testing early and often, we avoided building something based only on assumptions. I also learned the value of working closely in a cross-disciplinary team, as a designer alongside another designer and two developers where we combined different skills to deliver a real solution!

Create a free website with Framer, the website builder loved by startups, designers and agencies.